Introduction
Older people (aged ≥65 years) are a major group of patients who use acute medical and surgical services, but the specialist service provision for older adults with frailty within Scotland has never been systematically assessed. At a time when population ageing is a global phenomenon, with more people living longer and thereby increasing demands on services for older people, it is imperative that we have a detailed knowledge of care provision for older adults and identify any areas requiring more support and development.1
Within Scotland, National Health Service (NHS) health boards should be working towards fulfilling the sixteen standards from Healthcare Improvement Scotland (HIS) that have been developed to support staff and ensure high standards of care for older people presenting to hospital acutely.2 However, no information is available to understand the variation in services including manpower issues. It is well established that national audits can improve standards of care and lead to improved health outcomes, such audits are regularly carried out for conditions such as stroke, multiple sclerosis and in areas such as critical care and trauma.3–5
Within this context, the Scottish Care of Older People (SCoOP) national audit programme was launched in November 2017 in collaboration with the British Geriatrics Society (BGS) and HIS.6 Whilst the overarching aim of SCoOP is to provide benchmarking tools to further improve the care standards for older people across the nation, this initial scoping exercise sought to first establish whether basic differences in provision of specialist services for older adults and consultant geriatrician availability existed across the country, as part of planning a future in-depth approach combining a hospital-level survey with NHS Information Services Department (ISD) data.6 SCoOP follows on from the NHS Benchmarking report in April 2016 in England, which produced a highly detailed picture of the standards of acute hospital care for older people in 47 trusts and local health boards.7
Once fully established, SCoOP is expected to play an important role in improving patient safety, quality and standard of care, as well as fair and equitable access to care, and ultimately to contribute to a better overall quality of life for older people in Scotland. It will highlight service variations across the country, and help to avoid a ‘postcode lottery’ in the care an older person receives. It will inform the work of Health and Social Care partnerships across Scotland, who are responsible for delivering standardised care shown to be linked to optimal patient outcomes: they have already reduced variation in care and differences in outcomes previously observed.8 By doing so, we envisage SCoOP will pave the way for better and equitable care for older people in the UK NHS, and set gold standards as a good practice guide.
Methods
For this scoping exercise, a survey was designed and tested in two health boards prior to distribution to consultant geriatricians known to and nominated by the BGS Scotland Council from 12 of the 14 Scottish health boards. Each representative member of a health board completed data entry based on ‘best of their knowledge’ information. Data on consultant workforce were calculated based on sessional commitment, with 10 sessions equalling one full-time equivalent (FTE). Data on health board catchment population from the National Records of Scotland mid-2016 estimate were used to calculate the number of FTE geriatric consultants per 10,000 population aged 65 years and older for each health board.9 Data on the number of specialty doctors (nontraining grade) and trainees in specialty register training linked to each health board were also recorded by the representatives, but without sessional commitment.
Four acute service components were used to calculate a service provision score with a lowest possible score of 0 to a maximum possible of 1.0. This system was developed to enable comparison and has not been validated elsewhere. Four service components used were: (1) number of days/week in operation; (2) multidisciplinary team discussion frequency; (3) availability of physiotherapy services; and, (4) availability of occupational therapy services. The score for each service component was calculated by dividing the number of days each component occurred or was available for each unit of a health board by the number of days in a week (e.g. if daily physiotherapy provision then score was 1.0; if 5 days per week provision then score was 0.7). For those units where physiotherapy and occupational therapy were available on an ‘on request’ basis, this was counted as being available 2 days a week (score 0.3). The total acute service provision score was then calculated by adding the service component scores together for each aspect, and then dividing by four. Hence, each service component forms a quarter of the total score. For those health boards with more than one acute or community unit, a mean was taken of all units’ scores for purposes of comparison. Units labelled as ‘hospital at home’ or variations thereof were not included. Therefore, a service provision score of 1.0 represents a hypothetically ideal health board delivering full acute geriatric services at every unit on every day of the week. We used the same method for the calculation of community service score. The total population covered by each gradation of service provision score was calculated by summing together the number of ≥65 year olds in each health board for each score, and percentages were taken out of the total number of ≥65 year olds in Scotland.9
Descriptive analysis was performed using Microsoft Excel (Microsoft, USA) and results presented as median value with range and interquartile range. Results for consultant geriatrician provision and service provision scores were presented graphically using six colour gradations from red (low score) to green (high score) to demonstrate geographical variation.
Results
Data for acute services were provided by 12 out of 14 health boards, covering 99% of the Scottish population aged 65 years and over (data for community services were provided by 11 out of 14 health boards, 98% of the ≥65-year-old population). The health boards for which no response was obtained were remote and to the best of our knowledge do not have permanent geriatrician cover. There is a wide variation in the size of the population aged ≥65 years served by each health board (Figure 1) with a minimum of 4,403 (NHS Shetland) and a maximum of 190,573 (NHS Greater Glasgow and Clyde). Similarly, the number of FTE geriatric medicine consultants per 10,000 older people aged ≥65 years varies widely across the Scottish health boards (Figures 1 and 2) with a median of 1.45 [range: 0.54–2.40; interquartile range (IQR): 0.71–2.28] FTE geriatric consultants per 10,000 older people. The reference line in Figure 1 is calculated based on manpower level equivalent to two largest health boards proportionate to the population individual health boards are serving. The greatest consultant provision among responding health boards was in NHS Lothian, NHS Greater Glasgow and Clyde, and NHS Lanarkshire, with 2.40, 2.39 and 2.25 FTE geriatric medicine consultants per 10,000 older people, respectively. NHS Highland, NHS Dumfries and Galloway, and NHS Ayrshire and Arran had the lowest scores in this regard, all with less than 1.00 FTE geriatricians per 10,000 older people (0.54, 0.65 and 0.73, respectively).
Figure 1 Share of Scottish population aged ≥65 years covered by each health board and the corresponding staffing levels at consultant, specialist registrar and specialty doctor grades*. N.B. Consultant geriatricians are presented as number full-time equivalents (FTE), whereas specialty doctors and geriatric registrars are presented as the raw number of doctors employed within each health board.
*Values are shown by markers and line, and reference line included only to aid comparison
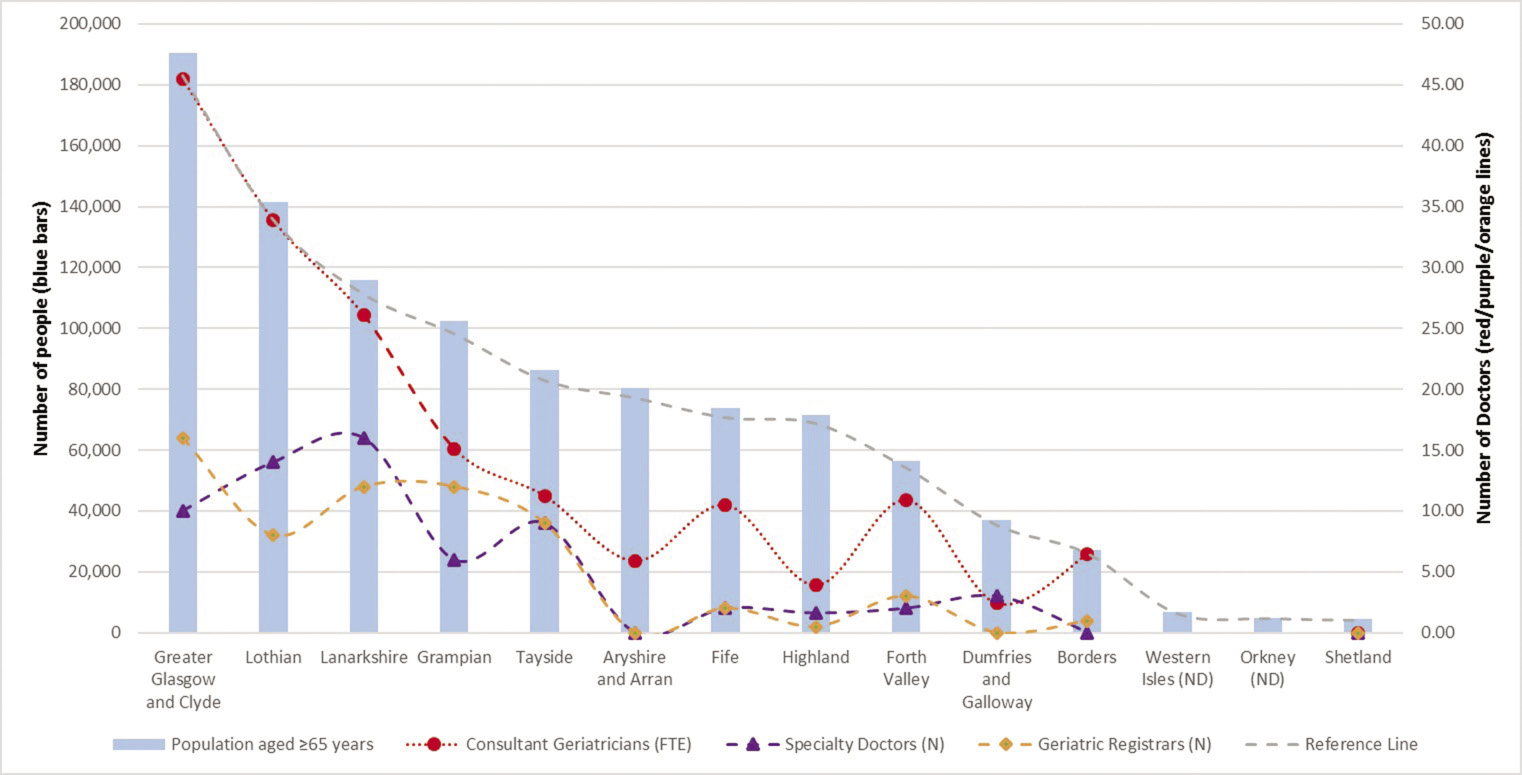
Figure 2 Consultant geriatrician provision in Scottish health boards in Spring 2018 [number of full-time equivalent (FTE) geriatric consultants per 10,000 population aged ≥65 years]. A: NHS Ayrshire and Arran; B: NHS Borders; C: NHS Dumfries and Galloway; D: NHS Fife; E: NHS Forth Valley; F: NHS Grampian; G: NHS Greater Glasgow and Clyde; H: NHS Highland; I: NHS Lanarkshire; J: NHS Lothian; K: NHS Shetland; L: NHS Orkney; M: NHS Tayside; N: NHS Western Isles
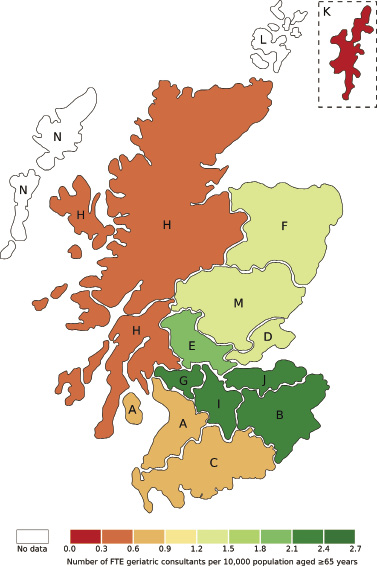
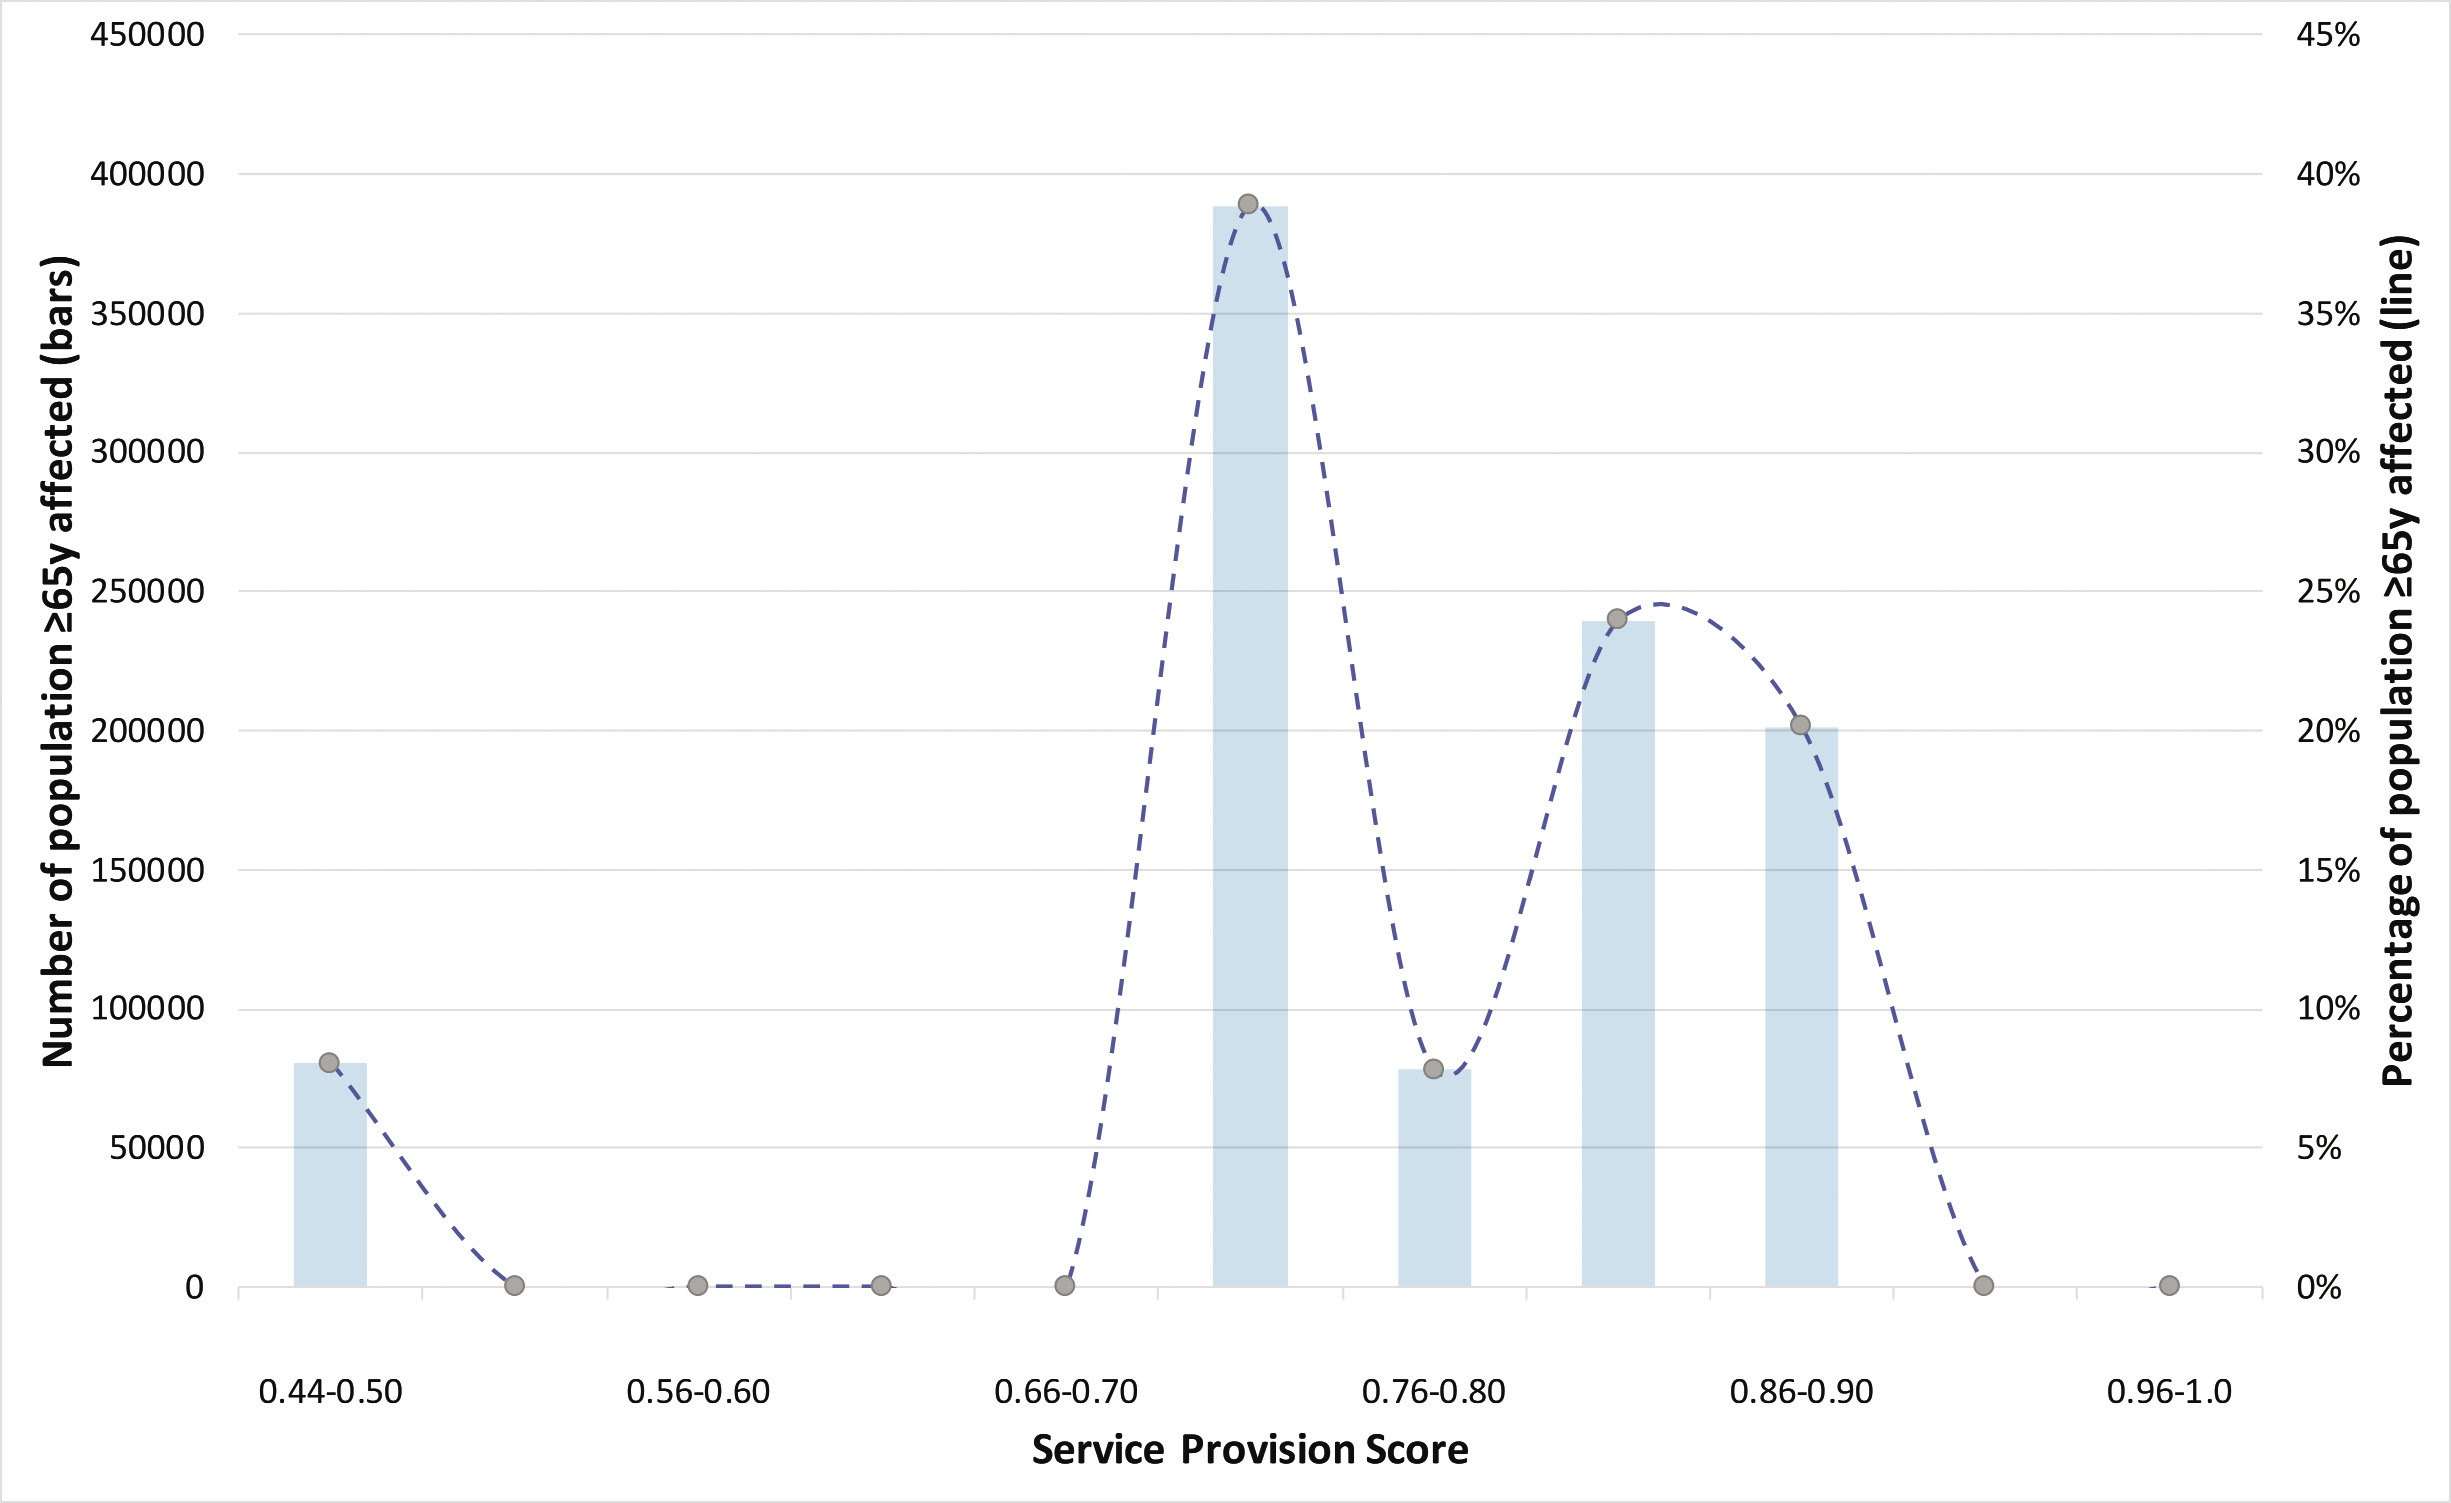
Table 1 summarises the data for each of the four components of the acute and community service provision scores. The distribution of acute and community service provision scores for each Scottish health board is shown in Figure 3. For acute services, the median national service provision score was 0.81 (range: 0.50–0.89; IQR: 0.75–0.85). Acute service provision scores were highest in NHS Grampian and NHS Highland (0.89 and 0.86, respectively), and lowest in NHS Ayrshire and Arran (0.50). For community services, the median national service provision score was 0.60 (range: 0.48–0.82; IQR: 0.52–0.65). Community service provision scores were highest in NHS Borders (0.82) and lowest in NHS Dumfries and Galloway (0.48). The population of those ≥65 years affected by the various gradation of service provision scores is presented in Figure 4.
Table 1 Summary of data contributing to overall acute and community service provision scores presented in order of decreasing population aged ≥65 years
|
|
|
|
|
|
|
|
|
|
|
|
|
|
|
|
|
|
Greater Glasgow
and Clyde
|
5 (2)
|
0.94
|
0.60
|
0.69
|
0.69
|
0.73
|
16 (6)
|
1.00
|
0.14
|
0.73
|
0.73
|
0.65
|
|
Lothian
|
5 (4)
|
1.00
|
0.49
|
0.71
|
0.77
|
0.74
|
6 (0)
|
1.00
|
0.07
|
0.50
|
0.50
|
0.52
|
|
Lanarkshire
|
15 (10)
|
1.00
|
0.83
|
0.81
|
0.73
|
0.84
|
14 (6)
|
0.84
|
0.14
|
0.68
|
0.68
|
0.59
|
|
Grampian
|
5 (5)
|
0.94
|
0.94
|
0.83
|
0.83
|
0.89
|
20 (1)
|
1.00
|
0.14
|
0.71
|
0.71
|
0.64
|
|
Tayside
|
5 (3)
|
1.00
|
0.83
|
0.71
|
0.71
|
0.81
|
10 (5)
|
1.00
|
0.14
|
0.71
|
0.71
|
0.64
|
|
Ayrshire and Arran
|
5 (3)
|
0.89
|
0.29
|
0.54
|
0.29
|
0.50
|
6 (2)
|
0.71
|
0.14
|
0.64
|
0.50
|
0.50
|
|
Fife
|
4 (3)
|
0.86
|
0.57
|
0.89
|
0.89
|
0.80
|
7 (3)
|
1.00
|
0.08
|
0.49
|
0.49
|
0.52
|
|
Highland
|
3 (1)
|
1.00
|
1.00
|
0.71
|
0.71
|
0.86
|
12 (0)
|
1.00
|
0.57
|
0.64
|
0.57
|
0.70
|
|
Forth Valley
|
1 (0)
|
1.00
|
0.00
|
1.00
|
1.00
|
0.75
|
4 (4)
|
1.00
|
0.14
|
0.54
|
0.71
|
0.60
|
|
Dumfries and Galloway
|
2 (1)
|
1.00
|
0.50
|
1.00
|
0.86
|
0.84
|
8 (0)
|
1.00
|
0.02
|
0.45
|
0.45
|
0.48
|
|
Borders
|
4 (2)
|
1.00
|
1.00
|
0.79
|
0.79
|
0.89
|
6 (0)
|
1.00
|
1.00
|
0.64
|
0.64
|
0.82
|
|
Western Isles
|
ND
|
ND
|
ND
|
ND
|
ND
|
ND
|
ND
|
ND
|
ND
|
ND
|
ND
|
ND
|
|
Orkney
|
ND
|
ND
|
ND
|
ND
|
ND
|
ND
|
ND
|
ND
|
ND
|
ND
|
ND
|
ND
|
|
Shetland
|
1 (0)
|
1.00
|
0.71
|
0.71
|
0.71
|
0.79
|
ND
|
ND
|
ND
|
ND
|
ND
|
ND
|
Figure 3 (a) Acute service provision score and (b) community service provision score. A: NHS Ayrshire and Arran; B: NHS Borders; C: NHS Dumfries and Galloway; D: NHS Fife; E: NHS Forth Valley; F: NHS Grampian; G: NHS Greater Glasgow and Clyde; H: NHS Highland; I: NHS Lanarkshire; J: NHS Lothian; K: NHS Shetland; L: NHS Orkney; M: NHS Tayside; N: NHS Western Isles
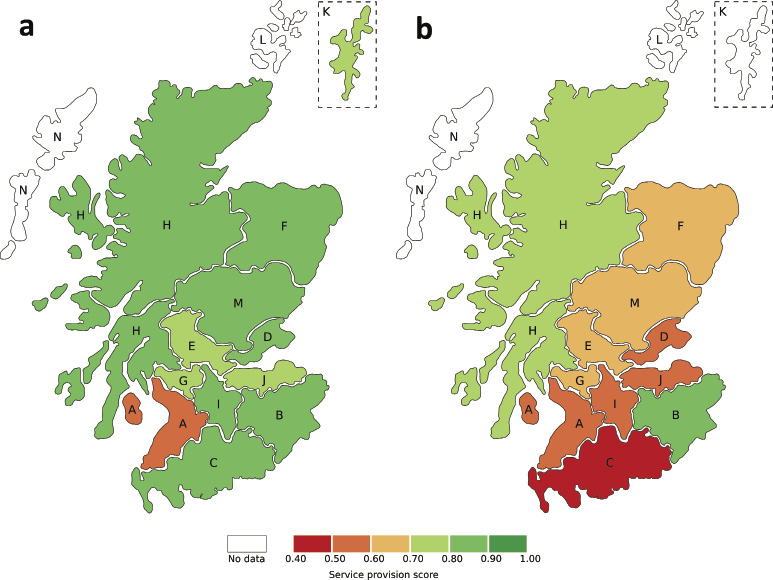
Figure 4 Number (bars) and percentage (line) of population ≥65 years (y) of age in Scotland in catchment area for health boards scoring at each gradation of service provision score for acute geriatric service provision
Discussion
In this initial scoping study of specialist service provision for older people in Scotland, we can already see huge variation in the reported data for both acute and community services. The SCoOP audit programme has been established to improve understanding of current care provision and thereby to promote equitable healthcare through benchmarking of care for our ageing population by joint working among stakeholders. We acknowledge that this exercise was merely the first step in mapping out Scottish services for older people, and while some aspects of service provision in terms of comprehensive geriatric assessment (CGA) and specialist staffing were covered (HIS standards 5 and 16, respectively), assessment of service quality was beyond the remit of this particular exercise.
As referred to earlier, there are several national audit programmes that have led to improved health outcomes, but there are also examples where such programmes have not achieved their goals. To the best of our knowledge, SCoOP is the first national collaborative of its kind working in collaboration between a specialist society and monitoring body (HIS in Scotland) to assess the variation in service provision for older adults across all geographical areas within a nation. It is hoped that pooling of expertise from both BGS and HIS, along with the already embedded proactive response to HIS inspections within healthcare, will help to make SCoOP a success. The early role of SCoOP will be to establish some clear criteria against which services can be fairly judged without ambiguity, which will be supplementary to the guiding principles already set out in the HIS standards.
At this stage it would be inappropriate to draw comparisons based on the scores of specific health boards since the results of this initial scoping survey are limited by the reliance on data based largely on ‘best of knowledge’ information from representative members from each health board, and there may be inaccuracies. Since this scoping exercise will be followed up by an in-depth survey, the responses were not duplicated for validation. The next audit cycle is planned to include a detailed survey that will be sent directly to individual hospitals, and will be complemented by population-level data, NHS organisation level and hospital level admission, and outcome data for all acute admissions across Scotland over a well-defined period to triangulate the survey results.
Part of the rationale for conducting this scoping exercise prior to a detailed survey, was that focus group discussion between specialist geriatricians from multiple Scottish health boards highlighted significant differences in the way care for older adults is structured, even between acute hospitals in the same health board. Moreover, it was apparent that different terminology may be used for the same concept, for example, wards caring specifically for older adults may be called an ‘acute frailty unit’, ‘acute care of the elderly (ACE unit)’ or ‘geriatric assessment unit’, amongst others. An additional challenge in comparing service provision is that some of the services used may not be exclusive to older people, and indeed not all hospitals will have a dedicated unit or ward for frailty assessment.
It is also recognised that the need for a comprehensive geriatric assessment is indicated not by age, but by a range of considerations including functionality. Ideally we would relate specialist service and workforce availability to the number of frail individuals in a specific catchment area, which may be possible in future with standardised use of an electronic frailty index in primary care. However, as an interim guide we used ISD population data of the number of over 65 year olds as a denominator to calculate the number of FTE consultant geriatricians per 10,000 older people. When interpreting the results, it must be remembered that each health board serves a very different population, not just in terms of number, but in geographical area and baseline health status. This provisional analysis has not included any adjustment for the baseline health of the population of over 65 year olds in each board, which would be expected to influence the demand for specialist geriatric services. Regional variation in health is predominantly driven by lifestyle rather than genetics, and has important implications for healthcare policies and service planning.10 In 2010–12 among NHS Boards, Greater Glasgow and Clyde had the lowest male life expectancy (74.5 years) and Orkney had the highest (79.7 years), but there was also huge variation within health boards, with a gap of 7.5 years between the life expectancy of local authorities Glasgow City (72.6 years) and East Dunbartonshire (80.1 years), which are both part of NHS Greater Glasgow and Clyde.1
We did not assign weightage with regard to service scores, rather we used a simple calculation based on four components of the services with all contributing equally. This scoring system is not validated, and for future audit cycles further development of a scoring system along with audit recipients through focus or Delphi groups will be important. However, although limited, the rudimentary scoring system does permit comparison to highlight that variation in service exists and provides an indication that further work is needed. It was beyond the remit of this audit to include other services, such as pharmacy and social services, or staffing levels for the full multidisciplinary team. This is important to consider for future audits, since nursing staffing levels have been shown to influence outcomes in other areas.11
In reporting the findings of this scoping survey, the service scores were developed to reflect some of the key aspects making up the process of CGA, which is a multidimensional, multidisciplinary diagnostic and therapeutic process. CGA aims to determine the medical, mental and functional problems of older people with frailty, thus facilitating design of a coordinated and integrated plan for treatment and follow up.6 A Cochrane Review in 2017 concluded that older patients are more likely to be alive and in their own homes at follow up if they received CGA on admission to hospital.12 The 2016 audit from the NHS England Benchmarking Network reported that 52% of trusts had a frailty unit and 89% of frailty units use CGA, but just 3% of the consultant workforce in older people’s care were geriatricians.7 The mean national acute service provision score from this survey (0.8) suggests that the process of CGA is well embedded in Scottish geriatric medicine, but it is clear that there is scope for improvement in delivering the basic aspects of CGA service provision captured in the score, and in ensuring a fair and standardised service is available to all older people living in Scotland.
It is interesting to note a disparity between the acute and community scores in this preliminary survey, especially since a multidisciplinary approach for older people in a rehabilitation-orientated setting remains important. Of note, the Highlands and Borders gained the highest scores in this regard, and this may reflect the greater needs of rural populations to have access to well-resourced local services. Again, these initial results should be interpreted cautiously while the comprehensive survey is awaited, and until it is better understood which outcomes are most important in understanding variation in service provision and outcomes.
This scoping exercise has highlighted variation in acute and community service provision and availability of geriatricians across Scotland, demonstrating the need for further work as we strive to provide equitable access to high-quality, person-centred healthcare for all older people. The next steps of SCoOP, should funding be secured, will be to pursue the overarching aims of: driving forward improvements and standardisation of healthcare for older people in Scotland; providing benchmarking tools to support health and social care improvement work; and to provide a health intelligence and knowledge transfer hub for service users, healthcare providers and policy makers through annual evaluation cycles. This will also serve as a data platform for health services research, and for the training and development of academics. The definitive aim of the wider project is to make Scotland a centre of excellence for the care of older people and to define the ‘gold standard’ for departments to strive for. Ultimately the success of health services for older adults will be measured by how many are enabled to remain independent and with a good quality of life without need for care.
Acknowledgements
We gratefully acknowledge the support of the British Geriatrics Society (BGS) in raising awareness of this work and the BGS Scotland Council for dissemination of the scoping survey. We also would like to thank Mr Tiberiu Pana, Mr Jesus Perdomo, Dr Maryam Barma and Dr Adrian Wood for their assistance with the project. We would also like to thank the SCoOP Steering Committee Members and Dr Claire Copeland (NHS Forth Valley) for their contribution. The SCoOP Steering Group includes: Dr Louise Beveridge (NHS Tayside), Professor Corri Black (University of Aberdeen), Ms Penny Bond (Healthcare Improvement Scotland), Dr Jennifer Burns (NHS Greater Glasgow and Clyde), Dr Tony Byrne (NHS Forth Valley), Dr Andrew Coull (NHS Lothian), Dr Alison Donaldson (University of Aberdeen), Dr Alice Einarsson (NHS Grampian), Professor Graham Ellis (NHS Lanarkshire, Glasgow Caledonian University and Co-Chair), Ms Karen Goudie (Healthcare Improvement Scotland) , Dr Graeme Hoyle (NHS Grampian), Dr Allan MacDonald (NHS Highland), Dr Christine McAlpine (NHS Greater Glasgow and Clyde), Dr Morven McElroy (NHS Greater Glasgow and Clyde), Professor Phyo Kyaw Myint (University of Aberdeen, Co-Chair), Dr Terence J Quinn (University of Glasgow), Professor Sir Lewis Ritchie (University of Aberdeen), Dr Susan Shenkin (University of Edinburgh), Dr Ralph Thomas (NHS Fife) and Dr Andrew Watt (NHS Ayrshire and Arran).
References
1 NHS National Service Scotland. Health and Wellbeing Profiles 2015. Scotland Overview Report. 2015. https://www.scotpho.org.uk/opt/Reports/ScotPHO-Health-Wellbeing-Report-2... (accessed 23/08/18).
2 Healthcare Improvement Scotland. Care of Older People in Hospital Standards. 2015. http://www.healthcareimprovementscotland.org/our_work/person-centred_car... (accessed 23/08/18).
3 Bray BD, Ayis S, Campbell J et al. Associations between the organisation of stroke services, process of care, and mortality in England: prospective cohort study. BMJ 2013; 346: f2827.
4 Intensive Care National Audit & Research Centre. Annual Quality Report 2016/17 for adult critical care. 2017. https://onlinereports.icnarc.org/Reports/2017/12/annual-quality-report-2... (accessed 23/08/18).
5 Royal College of Physicians. National Audit of services for people with multiple sclerosis: archived 2008 reports. 2008. https://www.rcplondon.ac.uk/projects/outputs/national-audit-services-peo... (accessed 23/08/18).
6 Ellis G, Myint PK. Scottish Care of Older people (SCoOP) Project. 2018. https://www.abdn.ac.uk/iahs/research/acer/scoop.php (accessed 23/08/18).
7 NHS Benchmarking Network. Older People’s care in Acute Settings Benchmarking 2016. 2017. https://www.nhsbenchmarking.nhs.uk/news/older-peoples-care-in-acute-sett... (accessed 23/08/18).
8 Scottish Parliament Information Centre. Integration of Health and Social Care. 2016. http://www.parliament.scot/ResearchBriefingsAndFactsheets/S5/SB_16-70_In... (accessed 23/08/18).
9 National Records of Scotland. Mid-2016 Population Estimated Scotland. 2017. https://www.nrscotland.gov.uk/statistics-and-data/statistics/statistics-... (accessed 5/4/18).
10 Amador C, Xia C, Nagy R et al. Regional variation in health is predominantly driven by lifestyle rather than genetics. Nat Commun 2017; 8: 801-017-00497-5.
11 Myint PK, O Bachmann M, Loke YK et al. Important factors in predicting mortality outcome from stroke: findings from the Anglia Stroke Clinical Network Evaluation Study. Age Ageing 2017; 46: 83–90.
12 Ellis G, Gardner M, Tsiachristas A et al. Comprehensive geriatric assessment for older adults admitted to hospital. Cochrane Database Syst Rev 2017; 9: CD006211.
