Introduction
The COVID-19 pandemic has highlighted the importance of timely interventions in responding to public health crises. In order to assess the impact of these interventions, methods for monitoring disease spread and burden must be easy to interpret and convey the trajectory of epidemics in real time. We propose a simple approach based on ratios of frequencies (of cases, hospital patients or deaths) over a rolling two-week period as a suitable metric. These ratios provide a straightforward and immediate indication of the current rate of spread of infection and its burden on health services. If the value of a ratio is below 1 this indicates that the epidemic is in decline. A value above 1 indicates it is growing. For example, if the weekly ratio for new cases is 0.5 this indicates that incidence is halving every seven days and if the ratio is 2 this indicates that incidence is doubling every seven days.
The first confirmed case of COVID-19 in Scotland was recorded on 1 March 20201. Along with the rest of the UK, Scotland implemented a range of non-pharmaceutical interventions (NPIs) throughout 2020, including the imposition and relaxation of multiple restrictions on social interactions.2,3 Here, we present a method to track the trajectory of the epidemic from data that were available from Health Protection Scotland (HPS) every day.1
Methods
Publicly available data on: confirmed cases, patients in hospital, patients in intensive care units (ICUs), and deaths were used to generate our indicators. The number of COVID-19 cases and deaths have been reported every day since the start of the epidemic by HPS.1 Deaths are defined as those which have been registered with the National Records of Scotland (NRS) where a positive test for COVID-19 was recorded in the 28 days prior to death. The NRS additionally reports all COVID-19 deaths (i.e. where COVID-19 was confirmed or suspected) every week4 but this was not sufficiently up to date to use for surveillance purposes. The number of COVID-19 patients in hospital and in ICUs at midnight is provided by NHS health boards on a daily basis (see Technical Appendix for further details).
We sought a robust method to monitor the epidemic’s trajectory. For both confirmed cases and deaths, we found that methods based on daily counts, e.g. growth rates, were affected by systematic low reporting of counts at weekends. We therefore chose to calculate ratios of the sum of new cases or deaths in the past week compared with the corresponding sum in the week before, on a rolling daily basis. Weekly ratios are a versatile and easily understood method for tracking multiple impacts of COVID-19, and have previously been proposed for the rapid detection of pandemic influenza in humans.5
Confidence intervals for the ratios (w1/w2) were calculated based on the approximate standard error for their logs, √{1/w1 + 1/w2}, where w1 = total cases in past week and w2 = total cases in week before (see Technical Appendix). Whilst weekly ratios were robust to weekday variations, they were still subject to the effects of low reporting on public holidays (when most registries were closed). We made a simple manual adjustment for this by apportioning the number of deaths reported on Mondays and Tuesdays of ‘holiday weeks’ to match the distribution of deaths observed on Mondays and Tuesdays of ‘non-holiday weeks’ (see Technical Appendix).
A similar method was used for patients in hospital and in ICUs. As patients were included in consecutive counts over several days, the ratio for these metrics was based on the count on a given day compared with the count one week before.
Results
The trends during the first wave are similar (Figure 1). All four ratios are clearly above 1 in late March, falling to values of approximately 1 in mid-April and maintaining values of less than 1 from late April until the end of the first wave, indicating that the first peak had passed. The ratio for cases was the first ratio to fall below 1, on 11 April, but did not stay consistently below 1 until after 25 April. This pattern may have been influenced by the increase in testing that occurred during that period. Ratios for deaths first fell below 1 on 19 April, and stayed at around this level for a further two weeks before becoming consistently lower in mid-May. This delayed decline is likely to have been influenced by the fact that the peak for deaths occurred later in care homes than in other settings, and also by the increasing proportion of ‘tested’ deaths being included in the HPS counts. Ratios for patients in hospital were the last of the four metrics to decline and did not fall below 1 until 20 April. However, this may be partly due to changes in policies for admitting and discharging patients resulting in longer durations of stay (e.g. the requirement for two negative tests for discharging care home residents).
Figure 1 Weekly ratios for new cases and deaths, and day-of-the-week ratios for patients in hospital and ICU from the start of the epidemic to 21 January 2021, plotted on a log10 scale. Hospital data between 10 and 16 September 2020 were removed due to a change in definition. Figure insets highlight ratios and trends for the last 21 days. The two series for patients in hospital and ICU start later because confirmed cases in hospital were not disaggregated from suspected cases until 27 March. Entries in grey are adjusted for public holiday effects.
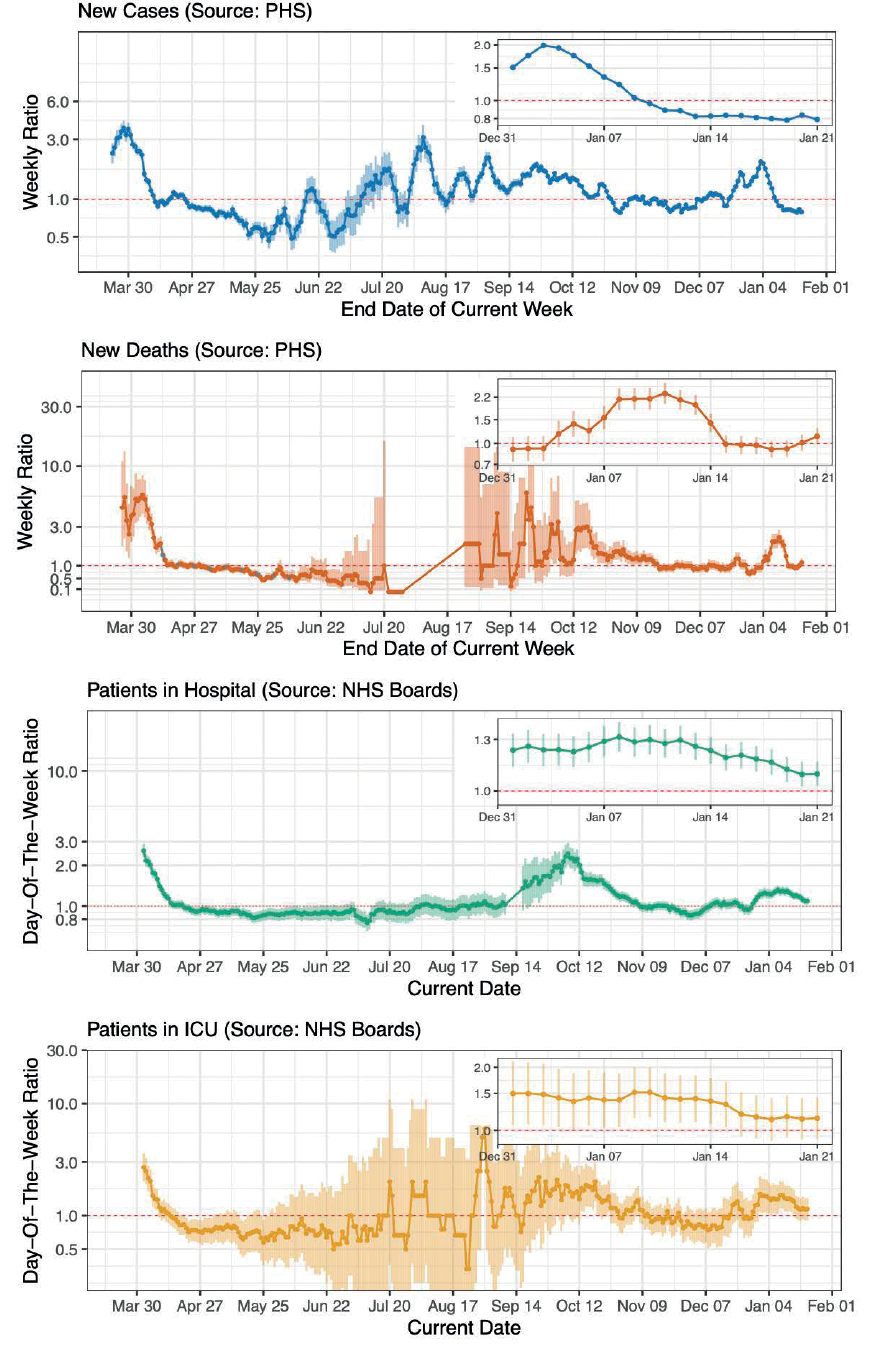
Ratios for patients in ICU first fell below 1 on 14 April and have remained below 1 since. However, this metric predominantly reflects cases occurring in the community rather than in care home residents as very few patients aged over 85 were admitted to ICU.
Taken together, the four metrics do indicate that the rate of spread of COVID-19 in Scotland decreased considerably after lockdown was introduced and that, from late April to at least early June, the epidemic was in consistent decline. We highlight that there was a lag of 3–4 weeks after lockdown before the metrics fell below 1.
The pattern from the end of the first wave to the middle of the second is more complex, with different indicators displaying different trends and a higher degree of volatility becoming apparent. The weekly case ratio rises and falls above and below 1 several times between mid-June and late July. The wider confidence intervals observed during this period are indicative of the lower number of new cases being recorded between the first and second wave. From early August to early November, case ratios are mainly above 1, indicating relatively sustained exponential growth during this period. Death ratios remained below 1 throughout the inter-wave period and were not computable between late July and mid-August as no deaths were recorded by HPS. Between late August and mid-October (when the number of deaths being recorded was low), death ratios fluctuate above and below 1 several times and display considerable volatility. From mid-October to mid-November, death ratios are consistently above 1. The trend for patients-in-hospital ratios is notably more consistent than those for other indicators and displays narrower confidence intervals throughout Spring and Summer. This ratio maintains values below 1 from mid-April to early August, before hovering around 1 until September, when the definition of the underlying metric was changed. From September until mid-November, the ratio for patients in hospital was clearly in excess of 1. The ratio for patients in ICU remained below 1 between the 14 of April and mid-July, before rising above and below 1 several times throughout late July and August and then maintaining values above 1 until mid-November.
Case ratios are below 1 until early December, before rising to values slightly above 1 in mid-December. In late December, case ratios rise sharply to values clearly in excess of 1, which are sustained throughout late December and into early January. Values decline from early January onwards and fell below 1 on 10 January 2021. Death ratios display a similar trend, but with a small delay. Values are close to 1 from mid-November until early January, when they rise sharply to values clearly above 1 before falling below 1 on 15 January. The patients-in-hospital ratio fluctuates above and below 1 from mid-November until late December, when values rise to levels clearly above 1 which have been maintained throughout January, up to the time of writing. The patients-in-ICU ratio was mainly below 1 between mid-November and early December, before fluctuating above and below 1 in mid-December and rising to levels clearly in excess of 1 in late December.
Figure 2 provides a snapshot of weekly case ratios for each local authority in Scotland over the first three weeks of 2021. Whilst there is some variation between local authorities (especially less-populous ones such as Orkney, Shetland and the Western Isles), a prevailing trend of ratios being clearly in excess of 1 in early January before dropping to below 1 in the second week of January is visible for most local authorities. Orkney, Shetland and the Western Isles were exempt from the level 4 restrictions which were implemented across mainland Scotland on 26 December 2020 and do not show the same trend. The effect of level 4 restrictions on transmission rates is likely the primary reason for the drop in weekly ratio values in mainland Scotland.
Figure 2 A snapshot of weekly ratios of COVID-19 cases in Scotland by local authority between 1 January 2021 and 21 January 2021, plotted on a linear scale. Local authorities are colour coded by the health board in which they sit.
These outputs formed part of a report which has been delivered to the Scottish Government’s COVID-19 Advisory Group every week. The ratios were straightforward for officials to interpret and contributed to the body of evidence considered when advising on the easing and implementation of NPIs.6
Discussion
We have demonstrated that weekly ratios are a versatile and easily understood method for tracking the COVID-19 epidemic. However, as can be seen in the four metrics considered here, different data sources are susceptible to different biases and these must be clearly communicated to policymakers. For cases and deaths, changes in testing policy and coverage can affect the comparability of these metrics over time. If test coverage is increased, then an increased proportion of clinically milder and previously overlooked cases is likely to be detected. Deaths counted by HPS are also directly affected by increased testing. Metrics may also be influenced by changes in policy, for example in policy regarding the hospitalisation, testing and discharge of elderly people and care home residents, implemented in late April.7,8
As deaths are generally less affected by changes in testing policy than cases, it could be argued that death ratios may be the most consistent indicator of COVID-19 spread. However, the number of new deaths is heavily influenced by the rate of spread to and within groups who are predisposed to negative clinical outcomes, such as the elderly and those with underlying medical conditions, many of whom live in communal settings and are dependent on close physical care. Ratios for deaths will therefore intrinsically reflect the rate of spread in these higher risk groups more than in lower risk groups. Other measures are similarly weighted towards more severely ill patients: cases only include people who have been able to get tested, and patients in hospital and ICU will only include those with sufficiently severe symptoms to require admission.
The case reproduction number (R) value has become an important metric in social and political settings to express the rate of spread of COVID-19, and the objective to keep it below 1 is straightforward to understand. However, R is challenging to estimate accurately from available statistics and published estimates are subject to a time lag.9 The metrics described here are much more straightforward to calculate and, when interpreted appropriately, can be used to assess the efficacy of NPIs and inform decisions about the easing of restrictions.
We conclude that a simple measure based on the ratio of weekly frequencies has proven to be an effective tool for monitoring the COVID-19 epidemic in Scotland. The complex dynamics of the epidemic are not easily visualised and are not easily captured by epidemiological models or estimates of the R value. Furthermore, weekly ratios have the advantage of being easily understood and can facilitate more direct interpretation of the available data. 
Acknowledgements
This work was funded by the University of Edinburgh.
Technical Appendix
The code used to produce our weekly report, and a similar report we distribute every day, is available at https://github.com/gcalder/COVID-19.
Data sources
The cumulative number of COVID-19 cases and deaths has been reported on every day since the start of the epidemic by HPS. Deaths are defined as those which have been registered with the National Records of Scotland (NRS) where a positive test for COVID-19 was recorded in the 28 days prior to death. These numbers are expected to capture the majority of COVID-19 deaths occurring in hospitals, but a lower proportion of deaths outside hospital settings, especially in late March and early April (when testing was mostly restricted to hospitalised patients.10,11 The NRS additionally report all COVID-19 deaths mentioned in the death certificate (i.e. where COVID-19 was confirmed or suspected) and therefore capture a greater proportion of deaths in care homes and the wider community. However, this report was issued only every week and was not sufficiently up to date to use for surveillance purposes. The number of COVID-19 patients in hospital and in ICUs at midnight is reported by NHS health boards every day. We included both confirmed and suspected patients in the ICU numbers but, due to reporting inconsistencies, included only confirmed patients in the patients-in-hospital figures.
Confidence interval calculation
Confidence intervals for the ratio have been calculated based on the standard error of the log of the ratio (w1/w2) which is approximated by √{1/w1 + 1/w2}, based on assuming a Poisson distribution for w1 and w2 (where w1 = total cases in past week, w2 = total cases in previous week). The approximation is obtained from the standard formula:
Var{log(a)} ≈ Var(a)/{Mean(a)}2
= a/a2 for a Poisson frequency
= 1/a.
The ratio on a log scale may be expressed:
log(w1/w2) = log(w1) – log(w2)
giving
Var{log(w1/w2)} = Var{log(w1) – log(w2)}
= Var{log(w1)} + Var{log(w2)}
= {1/w1 + 1/w2}
and
SE{log(w1/w2)} = √{1/w1 + 1/w2}.
The 95% confidence interval is then calculated as log(w1/w2) ± 1.96 x SE, which is exponentiated to provide the confidence intervals displayed.
Public holiday adjustment
Most registries are closed on public holidays so deaths cannot be registered. This causes a bias in the resulting ratio for deaths. For example, a low number of deaths was registered on 4 May (Spring bank holiday), followed by a high number on Tuesday 5 May. This caused the ratio for Monday 4 May to be artificially low, the ratio the following Monday (11 May) to be artificially high, and the ratio on the Monday two weeks later (18 May) to be artificially low. This was due to the separation of the (low and high) numbers for Monday 4 and Tuesday 5 May between the numerator and denominator for ratios on these Mondays. A similar pattern was noticed for other public holidays, e.g. 13 April (Easter Monday) and 18 May (Victoria Day), which affected ratios on the holiday dates and on the two subsequent Mondays in the same way. We made a simple manual adjustment for this bias by apportioning the number of deaths reported on Mondays and Tuesdays of ‘holiday’ weeks to match the distribution of those observed on Mondays and Tuesdays of ‘non-holiday’ weeks. For example, 44 and 83 deaths were reported by HPS for Monday 4 and Tuesday 5 May and these 127 deaths were redistributed to be 60 and 67, so that they followed the average proportions observed for ‘non-holiday’ Mondays and Tuesdays (47.1% and 52.9%).
Zero values
In the event that no new cases or deaths were recorded in the period 8–14 days before the sampling date, weekly ratios were deemed to be incalculable, and omitted from plots.