Introduction
Mental health problems are amongst the most frequently encountered health issues throughout life. In England, every year, one in ten children will suffer from mental health problems and one in six adults have a diagnosis of a common mental disorder.1,2 Worldwide, mental health and behavioural problems cause over 40 million years of disability in 20–29 year olds alone.3
Mental health interacts with and exacerbates physical illness. Between 12% and 18% of National Health Service (NHS) expenditure on long-term medical conditions, £8–13 billion in England, has been linked to poor mental health. Per person with a chronic medical condition, it increases the yearly cost of NHS service use by 45% from £3,910 to £5,670.4 Similarly, these patients have poorer surgical outcomes and incur higher costs than do the general population.5 Whilst prevalence data on psychiatric comorbidity in different patient groups are well described, little recent data exist on the impact that mental health has on a general hospital population in the NHS.
Methods
This is a cross-sectional study of all inpatients admitted to a general hospital. Ipswich Hospital (Ipswich, UK) provides services for approximately 385,000 people from a mixed urban and rural catchment area. The hospital has a total number of 650 beds, including 594 general and acute, 38 maternity and 15 critical care beds. Per year there are more than 88,000 inpatient admissions and similar numbers of emergency department (ED) attendances.6 The county of Suffolk ranks 101 out of 152 local authorities in England in the Index of Multiple Deprivation.7
The aim of the study was to investigate the prevalence and impact of psychiatric comorbidity in inpatients and to analyse diagnostic and demographic subgroups to inform planning for an integrated mental health service in our trust. From Monday 11 until Sunday 17 December 2017, staff in all inpatient areas identified patients with psychiatric comorbidity. Training on how to identify patients and how to collect data had been provided to audit champions who then taught additional staff in their departments. The criteria to identify patients are listed in Table 1.
Table 1 Reasons for inclusion
| |
Active psychiatric comorbidity including dementia that interferes with their management during this admission | 58.0 |
Self-reports current mental health problems (established diagnosis or symptoms attributed to poor mental health) | 31.3 |
Current or recent history of excessive alcohol or substance (recreational drug) use | 8.3 |
Overdose, deliberate self-harm, parasuicide, suicide attempt | 6.6 |
Is not allowed to leave as deemed not to have capacity under the Mental Capacity Act (MCA) | 5.9 |
Next of kin (including in minors the parents or guardian) report that the patient has or may have active mental health issues (established diagnosis or poor mental health) | 5.2 |
As a result of this admission is recommended to be referred to the memory clinic | 4.9 |
Is under Deprivation of Liberties Safeguards (DoLS) | 4.9 |
According to a senior decision maker in charge of the patient, they should be referred to psychiatry or a psychologist during this admission | 2.8 |
Has been referred to psychiatry or a psychologist during this admission | 2.1 |
Is waiting to be reviewed in the memory clinic | 1.7 |
Is detained under the Mental Health Act (MHA) | 1.7 |
Presents with medically unexplained symptoms or a diagnosis of a functional disorder | 1.0 |
Is suffering from an eating disorder | 0.3 |
Inpatients with psychiatric comorbidity during this period were also identified via clinical coding. We recorded demographics, comorbidities, admission diagnoses, use of excess alcohol and recreational drugs, mental health diagnoses (including if they were documented in the admission clerking) and referrals to psychiatry. For patients over 16 years of age we also recorded the Clinical Frailty Score,8 the Charlson Comorbidity Index9 and the results of a mental health screen that is part of our admission record.10 Patients who were identified both on the ward and via coding were only included once. For all inpatient episodes (with or without psychiatric comorbidity) during the investigation period, length of stay (LOS), number of prior presentations to the hospital in the year prior to the index admission, as well as 30-day readmissions and mortality were retrieved from the electronic health record.
The project was screened following the recommendations of the UK Healthcare Quality Improvement Partnership and the NHS Health Research Authority and categorised as a service evaluation.11,12 It was reviewed by our local Research Assessment Team (reference 17/129) who agreed that no other approval or oversight from the research office or a National Research Ethics Committee was necessary. It was subsequently registered with our Clinical Audit Department (project number B0293).
Statistical calculations were performed with RStudio Version 1.1.456 (RStudio, USA).13 The Shapiro–Wilk test was used to test for normality; the two-sample t-test, χ2 test and Fisher Exact test were used to compare subgroups. The level of significance was set at 0.05.
Results
A total of 288 patients with psychiatric comorbidity were identified; a prevalence of 11.8% in 2,444 inpatient episodes during the same period. Of these, 152 were included by hospital staff and a further 136 were found via clinical coding and subsequent review of clinical notes. A total of 17.4% of the 288 patients had not been coded for psychiatric comorbidity. The baseline characteristics of the patients are shown in Table 2 and the reasons for the inclusion of the patients in Table 1.
Table 2 Patient characteristics
| | | |
| | | | | |
n | 288 | 183 | 105 | | 111 | 176 | |
% | 63.5 | 36.5 | 38.5 | 61.1 |
|
Female (%) | 63.5 | 100.0 | 0.0 | | 56.8 | 67.6 | p = 0.078 |
Male (%) | 36.5 | 0.0 | 100.0 | 43.2 | 32.4 |
|
Range | 14–101 | 14–101 | 19–98 | p = 0.081 | 19–74 | 75–101 | p < 0.001 |
Mean | 70.3 | 74.9 | 70.4 | 52.2 | 86.9 |
Standard deviation | 21.1 | 21.6 | 20.0 | 18.1 | 5.7 |
<16 years old (paediatric age) | 0.3 | 0.5 | 0.0 | p = 1.000 | |
16–18 years old (transition age) | 0.0 | 0.0 | 0.0 | p = 1.000 |
19–75 years old | 38.5 | 34.4 | 45.7 | p = 0.061 |
≥75 years old | 61.1 | 65.0 | 54.3 | p = 0.080 |
|
n | 266 | 165.0 | 101.0 | p = 0.198 | 106.0 | 160.0 | p < 0.001 |
% of all | 92.4 | 90.2 | 96.2 | 95.5 | 90.9 |
Mean | 4.4 | 4.5 | 4.2 | 3.3 | 5.2 |
Median | 4 | 4.0 | 4.0 | 3.0 | 5.0 |
Range | 0–9 | 0–8 | 2–9 | 1–9 | 2–9 |
Standard deviation | 1.8 | 1.7 | 2.0 | 1.5 | 1.6 |
|
Mean | 2.0 | 2.0 | 2.0 | p = 0.875 | 1.4 | 2.4 | p < 0.001 |
Median | 2 | 2.0 | 2.0 | 1.0 | 2.0 |
Range | 0–8 | 0–8 | 0–8 | 0–8 | 0–8 |
Standard deviation | 1.9 | 1.8 | 2.0 | 1.7 | 1.8 |
|
Yes | 6.6 | 4.9 | 9.5 | p = 0.103 | 14.4 | 1.7 | p < 0.001 |
No | 51.4 | 49.2 | 55.2 | 47.7 | 53.4 |
Unknown | 42.0 | 45.9 | 35.2 | 37.8 | 44.9 |
|
Yes | 3.8 | 2.7 | 5.7 | p = 0.346 | 9.9 | 0.0 | p < 0.001 |
No | 40.3 | 39.3 | 41.9 | 33.3 | 44.3 |
Unknown | 55.9 | 57.9 | 52.4 | 56.8 | 55.7 |
|
Mean | 16.7 | 15.4 | 19.1 | p = 0.213 | 14.0 | 18.4 | p = 0.137 |
Median | 8.0 | 9.0 | 8.0 | 4.0 | 11.0 |
Range | 0–141 | 0–141 | 0–126 | 0–141 | 0–118 |
Standard deviation | 22.6 | 20.1 | 26.2 | 26.9 | 19.3 |
|
Inpatient | 8.7 | 7.1 | 11.4 | p = 0.276 | 14.4 | 5.1 | p = 0.009 |
Within 30 days post discharge | 0.7 | 0.5 | 1.0 | p = 1.000 | 0.0 | 1.1 | p = 0.524 |
Within 6 months post discharge | 4.9 | 3.3 | 7.6 | p = 0.152 | 5.4 | 4.5 | p = 0.783 |
30-day readmission rate (%) | 24.7 | 25.7 | 22.9 | p = 0.592 | 13.5 | 31.8 | p < 0.001 |
|
Mean | 2.3 | 2.4 | 2.2 | p = 0.476 | 2.5 | 2.3 | p = 0.389 |
Median | 2 | 2.0 | 2.0 | 2.0 | 2.0 |
Range | 0–12 | 0–12 | 0–10 | 0–12 | 0–8 |
Standard deviation | 2 | 2.1 | 1.9 | 2.4 | 1.8 |
|
Mean | 1.3 | 1.3 | 1.3 | p = 0.938 | 1.1 | 1.4 | p = 0.185 |
Median | 1 | 1.0 | 1.0 | 1.0 | 1.0 |
Range | 0–18 | 0–18 | 0–11 | 0–11 | 0–18 |
Standard deviation | 1.9 | 2.0 | 1.8 | 1.7 | 2.1 |
|
Mean | 0.2 | 0.2 | 0.3 | p = 0.265 | 0.2 | 0.2 | p = 0.825 |
Median | 0 | 0.0 | 0.0 | 0.0 | 0.0 |
Range | 0–4 | 0–3 | 0–4 | 0–3 | 0–4 |
Standard deviation | 0.6 | 0.5 | 0.7 | 0.6 | 0.5 |
|
Mean | 0.2 | 0.3 | 0.2 | p = 0.686 | 0.1 | 0.3 | p = 0.001 |
Median | 0.0 | 0.0 | 0.0 | 0.0 | 0.0 |
Range | 0–4 | 0–4 | 0–2 | 0–2 | 0–3 |
Standard deviation | 0.6 | 0.6 | 0.5 | 0.4 | 0.6 |
Patients with psychiatric comorbidity had a longer LOS, higher inpatient mortality and higher 30-day emergency readmission rate than those without comorbidity, but they also had a higher number of ED presentations and hospital admissions in the 12 months prior and within 30 days after discharge from their index admissions (Table 3).
Table 3 Emergency department (ED) presentations and hospital admissions in patients identified with psychiatric comorbidity compared to those without
| | | |
|
Mean | 5 | 16.7 | p < 0.001 |
Median | 1 | 8 |
Range | 0–114 | 0–141 |
Standard deviation | 10.9 | 22.6 |
|
Index admission | 3.3 | 8.7 | p < 0.001 |
Within 30 days post discharge | 0.5 | 0.7 | p = 0.660 |
30-day readmission rate | 9.7 | 24.7 | p < 0.001 |
|
Mean | 1.1 | 2.3 | p < 0.001 |
Median | 1 | 2 |
Range | 0–17 | 0–12 |
Standard deviation | 1.6 | 2 |
|
Mean | 0.6 | 1.3 | p < 0.001 |
Median | 0 | 1 |
Range | 0–11 | 0–18 |
Standard deviation | 1.3 | 1.9 |
|
Mean | 0.1 | 0.2 | p = 0.006 |
Median | 0 | 0 |
Range | 0–3 | 0–4 |
Standard deviation | 0.4 | 0.6 |
|
Mean | 0.1 | 0.2 | p = 0.006 |
Median | 0 | 0 |
Range | 0–3 | 0–4 |
Standard deviation | 0.3 | 0.6 |
Mode of admission, day of the week and time
Most patients were admitted via the ED. Saturdays and Tuesdays saw the highest number of patients with psychiatric comorbidity presenting as emergencies, with a peak in the afternoon and around midnight (Figure 1). The majority of patients identified were admitted under General and Older Peoples’ Medicine (Table 4).
Figure 1 Time of emergency presentation to the hospital, rounded to half hour, in percent
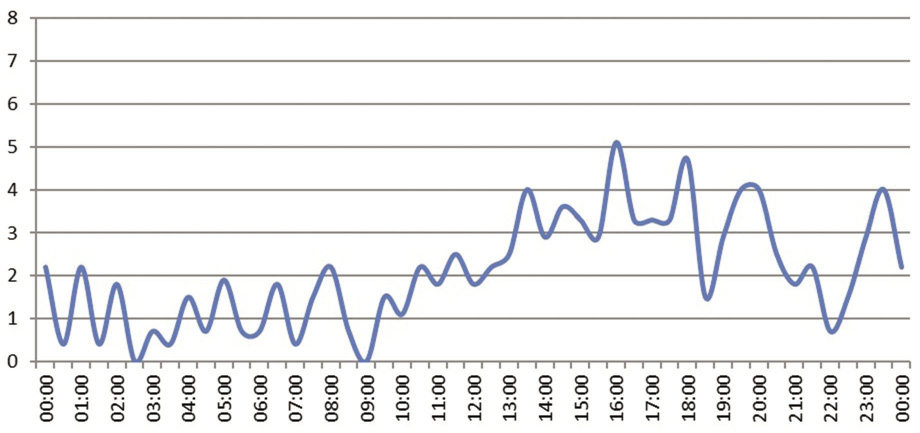
Table 4 The admission process
|
Emergency via Emergency Department | 82.6 % |
Emergency via GP | 10.1 % |
Emergency via outpatient clinic | 0.3 % |
Emergency – other | 1.4 % |
Maternity antepartum | 1.0 % |
Elective – waiting list | 2.8 % |
Elective – planned | 1.0 % |
Transfer from other hospital | 0.7 % |
|
General Medicine | 54.9 % |
Older Peoples’ Medicine | 15.3 % |
Trauma and Orthopaedics | 9.0 % |
Gastroenterology | 5.9 % |
General Surgery | 3.8 % |
Critical Care Medicine | 2.1 % |
Cardiology | 1.4 % |
Urology | 1.0 % |
Respiratory | 1.0 % |
Obstetrics | 1.0 % |
Clinical Oncology | 1.0 % |
Spinal Surgery | 0.7 % |
Colorectal Surgery | 0.3 % |
Hepatobiliary and Pancreatic Surgery | 0.3 % |
Endocrinology | 0.3 % |
Clinical Haematology | 0.3 % |
Nephrology | 0.3 % |
Paediatrics | 0.3 % |
Gynaecology | 0.3 % |
Gynaecological Oncology | 0.3 % |
|
Monday | 11.3 % |
Tuesday | 16.4 % |
Wednesday | 14.9 % |
Thursday | 12.7 % |
Friday | 12.7 % |
Saturday | 18.5 % |
Sunday | 13.5 % |
Weekday | 68.0% |
Weekend | 32.0% |
Mental health diagnoses
The most frequently recorded chronic diagnosis was dementia, followed by anxiety and depression (Table 5). An acute delirium was a diagnosis in 17.4% of patients and 5.2% presented acutely following an overdose with suicidal intention. In half of the patients it was not clear from the information in the admission notes if there was a current history of excessive alcohol or recreational drug use. A total of 7.6% of patients had been formally assessed as lacking capacity to leave against medical advice and for 4.9% Deprivation of Liberty Safeguards were in place. A total of 1.7% of patients were detained under the mental health act and 0.7% were guarded by hospital security at any time during their admission (Table 2).
Table 5 Mental health diagnoses
| | | | |
Mean | 1.4 | 1.6 | 1.3 | p = 0.001 |
Median | 1 | 1 | 1 |
Range | 1–5 | 1–5 | 1–5 |
Standard deviation | 0.7 | 0.9 | 0.6 |
| | | | |
Dementia | 49.7 | 9.1 | 72.2 | p < 0.001 |
Depression | 24.7 | 27.8 | 12.5 | p < 0.001 |
Anxiety disorder | 13.5 | 12.5 | 9.7 | p = 0.021 |
Substance abuse/addiction/AUD | 7.7 | 10.2 | 1.1 | p < 0.001 |
Bipolar disorder | 5.6 | 5.7 | 3.4 | p = 0.063 |
Schizophrenia | 2.8 | 2.8 | 1.7 | p = 0.268 |
Cognitive impairment, not further defined | 2.4 | 1.1 | 2.8 | p = 0.710 |
Previous overdose | 1.7 | 2.8 | 0.0 | p = 0.008 |
BPSD | 1.4 | 1.1 | 1.1 | p = 0.642 |
Personality disorder | 1.4 | 2.3 | 0.0 | p = 0.022 |
Autism | 1.0 | 1.7 | 0.0 | p = 0.057 |
Eating disorder | 1.0 | 1.1 | 0.0 | p = 0.149 |
Attention deficit hyperactivity disorder | 0.7 | 1.1 | 0.0 | p = 0.149 |
Panic disorder | 0.7 | 0.6 | 0.6 | p = 1.000 |
Previous psychosis | 0.7 | 0.0 | 1.1 | p = 0.524 |
Schizoaffective disorder | 0.7 | 0.6 | 0.6 | p = 1.000 |
Challenging behaviour | 0.3 | 0.6 | 0.0 | p = 0.387 |
Deliberate self-harm | 0.3 | 0.6 | 0.0 | p = 0.387 |
Korsakoff’s syndrome | 0.3 | 0.6 | 0.0 | p = 0.387 |
Learning difficulties | 0.3 | 0.6 | 0.0 | p = 0.387 |
Obsessive compulsive disorder | 0.3 | 0.0 | 0.6 | p = 1.000 |
Post-traumatic stress disorder | 0.3 | 0.0 | 0.6 | p = 1.000 |
Presenting with acute delirium | 17.4 | 5.1 | 23.3 | p < 0.001 |
Presenting with overdose (with suicidal intent) | 5.2 | 8.0 | 0.6 | p < 0.001 |
Presenting with ‘low mood’, no specific diagnosis | 1.7 | 1.7 | 1.1 | p = 0.378 |
Presenting with an acute psychosis | 0.7 | 1.1 | 0.0 | p = 0.149 |
Presenting with suicidality | 0.7 | 1.1 | 0.0 | p = 0.149 |
Presenting with attempted hanging | 0.3 | 0.6 | 0.0 | p = 0.387 |
Mental health screening
Earlier in 2017, the Ipswich Hospital introduced screening questions in the adult patients’ admissions record to encourage staff to ask patients if they had problems with their mental health and if they wanted to receive help for this.10 This was completed in 9.0% of patients, of these 46.2% stated they wanted input. Only three were handed and completed the Patient Health Questionnaire – Somatic, Anxiety and Depressive Symptoms (PHQ-SADS) questionnaire14 that forms part of the screening.
Referrals to liaison psychiatry
A total of 9.4% were referred during their hospital stay to liaison psychiatry. The main reason for not referring was that the treating team did not think it was necessary (82.4%). A total of 18.4% were not referred as there was no service available. All were fit for assessment when referred, 48.1% were fit for discharge. In 85.2% the patient’s discharge depended on the review.
Female vs male
There was no significant difference between female and male patients apart from substance use or addiction (Table 2).
Older vs younger
Patients aged ≥75 years were the largest group with psychiatric comorbidity and differed significantly from adults aged 18–75 years: they were frailer and scored higher on the Charlson index. Their inpatient mortality was lower (5.1 vs 14.4%; p = 0.009) but they had a higher 30-day readmission rate (31.8 vs 13.5%; p < 0.001). They less frequently had multiple psychiatric diagnoses. Their predominant diagnosis was dementia (72.2 vs 9.1%; p < 0.001), whereas in the younger group it was depression (27.8 vs 12.5%; p < 0.001). Alcohol excess was rare in older patients and not a single patient used recreational drugs or had previously attempted suicide. The two groups did not differ in LOS, number of ED presentations, hospital admissions in the year prior to their index admission or ED presentations in the first 30 days after discharge. Older patients had higher numbers of 30-day readmissions. By contrast, their mortality during their index admission was significantly lower (Table 2). When presenting as an emergency, older patients presented more frequently on weekends (37.0 vs 23.8%; p = 0.032). Their most frequent day of presentation was Saturday whilst for younger patients it was Tuesday. Older patients were less likely to be referred to liaison psychiatry (2.8 vs 19.8%; p < 0.001).
Discussion
Nearly one in eight of all inpatients were found to have psychiatric comorbidity. This is lower than the results of previous studies both in and outside of the UK that suggested a prevalence between 15% and 50%.15–24 Differences in healthcare services, methodology and sampling, and also in the populations feeding into the hospitals make it difficult to compare studies. Outcome measures in patients with psychiatric comorbidity (LOS, readmission rates and mortality) and service use (number of admissions and presentations to the ED) were higher than in patients without. This effect of psychiatric comorbidity on admission outcomes is an association that has been well described before.25,26 Mental health has a direct effect on physical wellbeing as well as the perception of illness. Psychiatry input can positively influence these outcomes. By targeting this patient group it is possible to improve the quality of healthcare and reduce the burden of excessive readmissions.27
The study identified peak times at which patients with psychiatric comorbidities presented as emergencies. To support patients from the time of presentation on, a 24-hour service may be necessary. By contrast, in England, liaison psychiatry is provided 24/7 in only 52% of hospitals to the ED and in 33% to all wards.28 Psychiatric diagnoses were not recorded in 14.6%. This mirrors the findings by NCEPOD,29 but also has an impact on clinical coding and through this on business analytics and service planning.30 One in six of our patients would have been missed if relying on coding alone. There was a poor uptake of the mental health screening by the staff at the Ipswich Hospital. This had only recently been introduced and not all members of staff may have been aware of it. Furthermore, in the initial pilot10 significant barriers by the staff who felt uncomfortable addressing patients’ mental health were described, a stigma that does require ongoing education. Our referral numbers to liaison psychiatry were low. This was caused in part by limited access via the ED and the assessment areas only. In a large proportion of patients, the clinicians did not deem a referral necessary. Various referrer and patient factors have previously been identified that influence referral to psychiatry. Understanding the potential barriers is an important step toward improving referral rates.31 These patients have significantly poorer admission outcomes and liaison psychiatry can have a significant impact towards improving these.
Some of the differences in outcomes between younger and older patients can be explained by higher frailty and a larger number of comorbidities. Older patients have more chronic illnesses and hospital admissions are often managing exacerbations with a temporary loss of function and increased care needs rather than life-threatening illness. Few of the older patients were consuming excessive alcohol and none was using recreational drugs. Whilst in the admission notes the use of recreational drugs or alcohol was poorly documented, the prevalence of alcohol use disorders in the elderly is estimated in the literature to be between 1% and 3%, which is similar to the number found in this study.32 Alcohol consumption declines with age, but a significant number of older people do consume harmful amounts of alcohol, often having started to drink in excess at an older age. In England, from 2016–17, 30% of hospital admissions related primarily to alcohol were aged ≥65 years. In future, substance misuse in older patients will become an ever more evident issue as the generation of ‘baby boomers’, people born between 1946–64 with a significantly high rate of recreational drug use, age.33 It is important to assess patients’ alcohol, nicotine and recreational drug habits, whatever their age.
There are limitations to this study that took place in a single centre over a 1-week period. As such, it cannot take into account possible variations throughout the year or in different populations in other parts of the UK. There were few paediatric patients and none in the transition age was identified. Diagnoses were accepted as documented in the clinical record of the patients and not clinically validated further. We did not investigate systematically for not yet diagnosed psychiatric comorbidity as some of the prior epidemiological studies did. When interpreting the outcomes of admissions in our patients, it is important to take into account that the data available on patients without psychiatric comorbidity did not allow us to look at other confounders that may have influenced these results.
In a general hospital, the main focus is to cater to the patients’ medical or surgical needs. Patients are being looked after according to their acute problem, and only in a crisis situation are other specialities being actively involved in the care of an individual. Yet, psychiatric comorbidity is so widely present both in the general population and in inpatients with a significant impact on patients’ physical health and admissions outcomes, that a more holistic approach is needed. To inform and guide planning for an integrated mental health service, comprehensive data are needed. On the basis of this evaluation, and within the above limitations, the author hopes to have achieved a detailed account of the nature and impact of psychiatric comorbidity in our hospital. These data, which show that a sizeable proportion of our inpatients have psychiatric comorbidity, are being used locally to work with all relevant stakeholders towards a liaison psychiatry service that includes all patient groups and clinical areas. The data should also encourage further research on the subject within the NHS.
Acknowledgements
I would like to thank the staff at the Ipswich Hospital, the Norfolk and Suffolk Foundation Trust and the East Suffolk Clinical Commissioning Group for their ongoing support of the development of an integrated mental health service for all patients. I am particularly indebted to the following colleagues who have been involved in the data collection for this study: Dr Amanda Halliday, Dr Anne Robins, Dr Carrie Morgan, Dr Chanaka Jayawardena, Dr Dan Coates, Dr Devraj Kathwadia, Dr Diana Lobo, Dr Dot Abiola, Sister Fiona Rawson, Dr Gemma Wilson, Sister Hannah Page, Dr Hansini Jankee, Dr James Sawali, Dr Javed Saumtally, Dr Jessica AitByaAlla, Dr Julia Jenkins, Sister Kate Mawson, Ms Kelly Lambert, Dr Komal Khalil Ch, Ms Linda Savage, Dr Louise Finch, Ms Maria Cooke, Dr Marjan Raad, Dr Michael Riveros-Laycock, Dr Miriam Ball, Sister Naomi Gunton, Dr Navleen Kalsi, Dr Nisha Marley, Dr Ola Ahmad, Dr Richard Bisset, Dr Richard Lloyd, Dr Rizvan Ahmed, Dr Shereen Hassan, Dr Syed Mazhar, Sister Tracey Boon, Dr Win Oo and Dr Yasser Tahir.
References
1 Green H, McGinnity A, Meltzer H et al. Mental Health of Children and Young People in Great Britain, 2004. London: Palgrave Macmillan; 2005.
2 McManus S, Bebbington P, Jenkins R et al. Mental Health and Wellbeing in England: Adult Psychiatric Morbidity Survey. London: NHS Digital; 2014.
3 Lozano R, Naghavi M, Lim SS et al. Global and regional mortality from 235 causes of death for 20 age groups in 1990 and 2010: a systematic analysis for the Global Burden of Disease Study 2010. Lancet 2012; 380: 2095–128.
4 Naylor C, Parsonage M, McDaid D et al. Long-term Conditions and Mental Health: The Cost of Co-morbidities. London: The King’s Fund and Centre for Mental Health; 2012.
5 McBride KE, Solomon MJ, Young JM et al. Impact of serious mental illness on surgical patient outcomes. ANZ J Surg 2018; 88: 673–7.
6 Care Quality Commission. Ipswich Hospital NHS Trust Inspection Report. Newcastle upon Tyne: Care Quality Commission; 2018.
7 Suffolk Observatory – Deprivation. https://www.suffolkobservatory.info/deprivation/ (accessed 11/12/18).
8 Rockwood K, Song X, MacKnight C et al. A global clinical measure of fitness and frailty in elderly people. CMAJ 2005; 173: 489–95.
9 Charlson ME, Pompei P, Ales KL et al. A new method of classifying prognostic comorbidity in longitudinal studies: development and validation. J Chronic Dis 1987; 40: 373–83.
10 Guruparan T, Kirupakaran A, Ansari S et al. If you don’t ask, you won’t know. Bridging the gap between mental health and acute care. Poster session presented at: Society Acute Medicine Spring Conference; 2017 May 4–5; Cardiff, UK.
11 Brain J, Schofield J, Gerrish K et al. A Guide for Clinical Audit, Research and Service Review. London: Healthcare Quality Improvement Partnership; 2011.
12 NHS Health Research Authority. Is my study research? http://www.hra-decisiontools.org.uk/research/ (accessed 12/12/17).
13 RStudio. RStudio by Rstudio Inc. 2018. https://www.rstudio.com/products/rstudio/ (accessed 12/12/18).
14 Kroenke K, Spitzer RL, Williams JBW et al. The patient health questionnaire somatic, anxiety, and depressive symptom scales: a systematic review. Gen Hosp Psychiatry 2010; 32: 345–59.
15 Clarke DM, Minas IH, Stuart GW. The prevalence of psychiatric morbidity in general hospital inpatients. Australas Psychiatry 1991; 25: 322–9.
16 Leung CM, Chan KK, Cheng KK. Psychiatric morbidity in a general medical ward. Hong Kong’s experience. Gen Hosp Psychiatry 1992; 14: 196–200.
17 Silverstone PH. Prevalence of psychiatric disorders in medical inpatients. J Nerv Ment Dis 1996; 184: 43–51.
18 Arolt V, Driessen M, Dilling H. The Lübeck general hospital study. I: prevalence of psychiatric disorders in medical and surgical inpatients. Int J Psychiatry Clin Pract 1997; 1: 207–16.
19 Martucci M, Balestrieri M, Bisoffi G et al. Evaluating psychiatric morbidity in a general hospital: a two-phase epidemiological survey. Psychol Med 1999; 29: 823–32.
20 Wancata J, Benda N, Windhaber J et al. Does psychiatric comorbidity increase the length of stay in general hospitals? Gen Hosp Psychiatry 2001; 23: 8–14.
21 Hansen MS, Fink P, Frydenberg M et al. Mental disorders among internal medical inpatients: prevalence, detection, and treatment status. J Psychosom Res 2001; 50: 199–204.
22 Furlanetto LM, Da Silva RV, Bueno JR. The impact of psychiatric comorbidity on length of stay of medical inpatients. Gen Hosp Psychiatry 2003; 25: 14–9.
23 Häuser W, Wilhelm-Schwenk R, Klein W et al. Einfluss psychischer Komorbidität auf die stationäre Verweildauer internistischer Patienten im G-DRG-System [in German]. Psychother Psychosom Medizinische Psychol 2006; 56: 370–5.
24 AIHW. Australian Institute of Health and Welfare: Comorbidity of Mental Disorders and Physical Conditions 2007. Canberra: AIHW; 2012.
25 Ahmedani BK, Solberg LI, Copeland LA et al. Psychiatric comorbidity and 30-day readmissions after hospitalization for heart failure, AMI, and pneumonia. Psychiatr Serv 2015; 66: 134–40.
26 Niedzwiecki MJ, Sharma PJ, Kanzaria HK et al. Factors associated with emergency department use by patients with and without mental health diagnoses. JAMA Netw Open 2018; 1: e183528.
27 National Institute for Health and Care Excellence. Chapter 23 Liaison psychiatry. In: Emergency and Acute Medical Care In Over 16s: Service Delivery and Organisation. NICE Guideline 94. London: National Institute for Health and Care Excellence; 2018.
28 Walker A, Barrett JR, Lee W et al. Organisation and delivery of liaison psychiatry services in general hospitals in England: results of a national survey. BMJ Open 2018; 8: e23091.
29 National Confidential Enquiry into Patient Outcome and Death (NCEPOD). Treat as One. Bridging the Gap Between Mental and Physical Healthcare in General Hospitals. London: NCEPOD; 2017.
30 Data Services for Commissioners (DSfC) NE. Data Quality Guidance for Providers and Commissioners Data Services for Commissioners. London: NHS Digital; 2016.
31 Chen KY, Evans R, Larkins S. Why are hospital doctors not referring to Consultation-Liaison Psychiatry? – a systemic review. BMC Psychiatry 2016; 16: 390.
32 Caputo F, Vignoli T, Leggio L et al. Alcohol use disorders in the elderly: a brief overview from epidemiology to treatment options. Exp Gerontol 2012; 47: 411–6.
33 Royal College of Psychiatrists. Our Invisible Addicts (2nd edition), College Report CR211. London: Royal College of Psychiatrists; 2018.